Coronavirus: statistics show lockdowns are slowing rate of infection

The battle to stop the spread of coronavirus is one of statistics as well as healthcare measures and social distancing. So where does the Netherlands really fit in?
Since the Dutch government implemented its ‘intelligent lockdown’, the emphasis has been on reducing the spread of the infection to prevent the healthcare system becoming overburdened.
In countries where the outbreak began earlier, such as Spain and Italy, tougher lockdown measures are in place, but the health service has been unable to keep up with the number of patients needing intensive care. Both countries recorded between 500 and 1,000 deaths a day throughout the last week of March.
The Netherlands has avoided that bleak scenario so far mainly because it introduced social distancing measures at an earlier stage of the outbreak. Italy had the misfortune to be first in line when Covid-19 reached Europe and served as an early warning for other nations.
When the Italian government quarantined the whole country on March 9 it seemed a drastic step, but by then the country was already recording more than 1500 new infections a day. The Dutch government shut down bars, restaurants and sports and social clubs and banned public gatherings on March 15, when the total number of confirmed cases was still below 1200.
The following weekend a chart was circulated on social media comparing the number of cases and deaths in the Netherlands with Italy 16 days earlier. Direct comparisons between countries is problematic, not least because of the differences in testing policies, but revisiting the same chart just over a week later gives an indication of how the Netherlands is moving off the Italian trajectory.
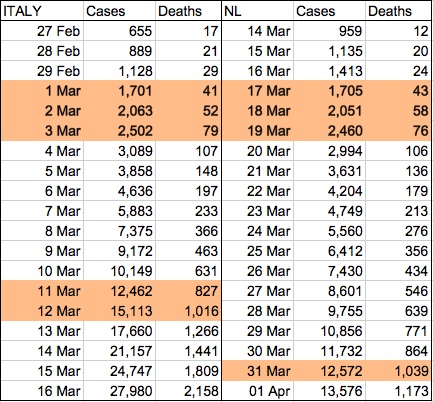
By this rough measure, the Netherlands is now 20 days behind Italy’s number of deaths and 19 days behind in terms of confirmed cases, and we can expect the gap to increase in the coming weeks.
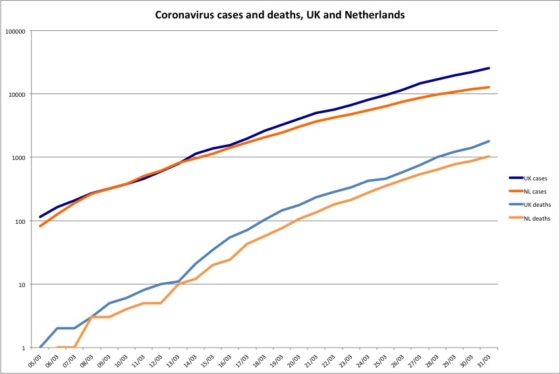
Another interesting comparison is with the United Kingdom. The two countries marched more or less in lockstep up until March 13, with the Netherlands recording six more cases and one more death at that point. But from that point on Britain started to pull ahead.
The Dutch had announced their first social distancing measures five days earlier – initially confined to North Brabant, where the disease was most widespread. The British government closed its schools on March 20 and went into full lockdown on March 23. As a result the infection rate did not start to slow down until later and the number of deaths recorded on April 1 was three times the Dutch figure.
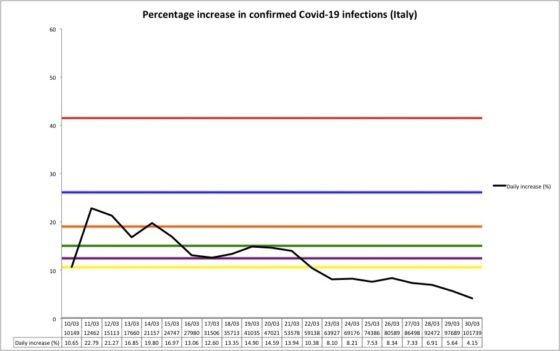
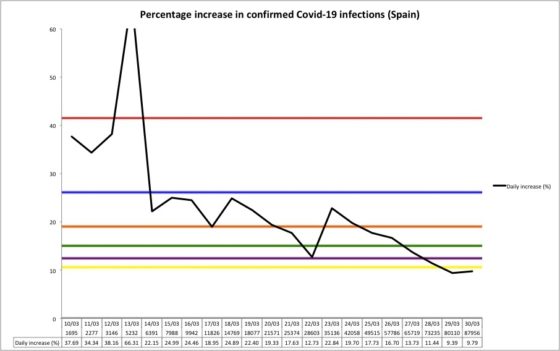
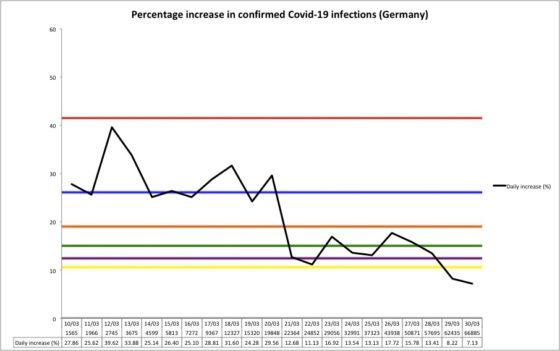
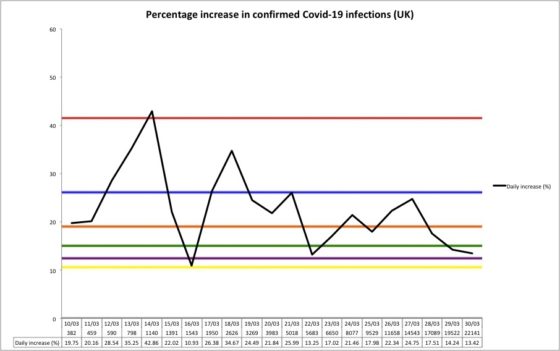
The purpose of social distancing is to flatten the curve. This doesn’t mean banishing the virus altogether, but slowing down the rate of infection to prevent too many people falling ill at once and overloading the healthcare system. Left unchecked the disease spreads at an exponential rate, with infections doubling every two to three days. This was the experience in nearly all countries before restrictions were introduced, as the following charts show.
Here we see that Italy, which quarantined its population first, started to see its growth rate decline on March 15, six days after it imposed a nationwide quarantine. Spain had a rapid rise in cases in early March and locked down its population on the 15th; its rate has been falling steadily since the 23rd.
In the Netherlands and Germany, where restrictions were tightened gradually, a significant downturn came in the last week, while the UK’s numbers started to drop on the 28th, five days after its lockdown began.
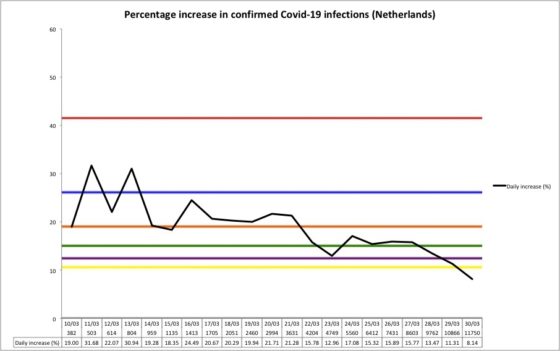
In these graphs, the coloured lines are a guide to show how quickly cases double in number. A country whose growth rate sticks around the red line (41.4%) will see cases double in two days; the blue line (26.0%) represents three days, orange (18.9%) shows the four-day mark, and so on.
All countries started out between the red and blue lines, doubling in two to three days, and in some cases – such as Spain – grew even faster. The actual numbers show Italy has slowed its doubling rate to 11 days while France, Spain and Germany are down to six days.
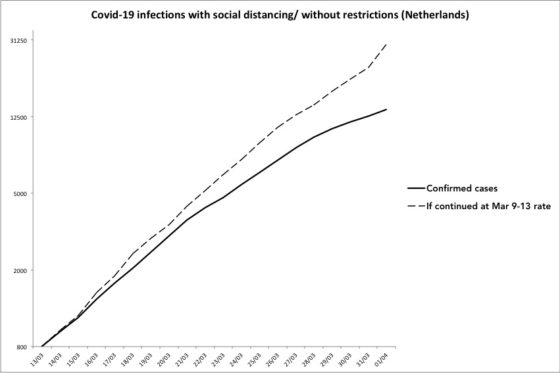
In the case of the Netherlands, the number of positive tests tripled between the 9th and 13th of March, immediately after the first social distancing measures were taken but before they had time to take effect. Had that level been sustained there would been nearly 30,000 confirmed cases by the beginning of April, twice as many as the actual number.
Of course, the positive test rate depends heavily on how many tests are carried out. The Dutch have been criticised for their low testing rate compared to other countries, limiting tests to healthcare workers and people who develop severe symptoms.
The World Health Organisation has been adamant that widespread testing is key to tracking and controlling the spread of the disease, but many countries have been hampered by restricted capacity.
RIVM figures show that the Netherlands is currently carrying out between 3,000 and 4,000 tests a day, compared to more than 50,000 in Germany. That number goes a long way to explaining why the Netherlands’ mortality rate is much higher than in countries such as Germany and South Korea:
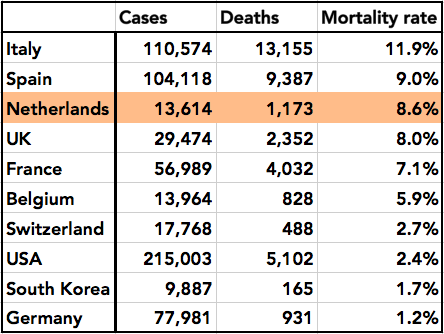
Researchers have estimated the true fatality rate of Covid-19 as anywhere between 0.4% and 3.8%, while South Korea, which has comprehensive testing and a longer history of the disease, records a rate of 1.7%. Applying the Korean rate to the Netherlands would suggest the number of infections is at least five times higher than the official figures.
But low testing also means the number of deaths is under-reported, since Covid-19 is only given as the cause of death for patients who have tested positive. Health minister Hugo de Jonge has said the Dutch government will step up its daily testing capacity in the next few weeks to 29,000.
Another statistic that has raised eyebrows is the Netherlands’ relatively high death rate per capita. Among countries with more than 10,000 cases the Dutch rank fourth, with 71 deaths per million population.
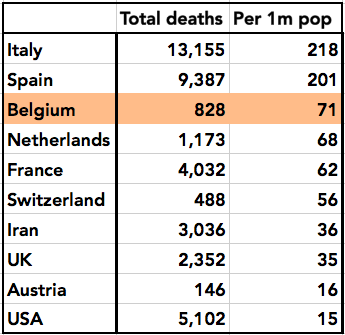
However, per capita deaths aren’t a good yardstick in the early stages of an outbreak. In most countries Covid-19 infections are confined to one or two regions: even in the United States half of all confirmed cases are in New York and New Jersey, which have a combined population of 27.5 million.
In those two states the death rate is around 93 per capita – but even then, the comparison is flawed because the outbreak in the Netherlands isn’t uniformly spread either.
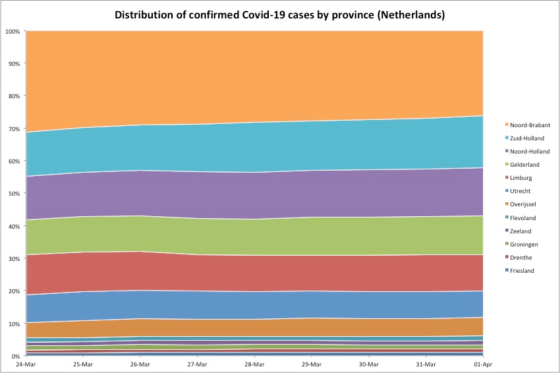
Five Dutch provinces – Drenthe, Groningen, Friesland, Flevoland and Zeeland – account for less than 6% of infections, even though they make up around 14% of the total population. Groningen, which has a population of nearly 600,000, had just eight new cases on April 1.
All a low per capita rate really tells you is that there are large areas of the country that the disease hasn’t reached – and in bigger countries, it will take longer to reach those places than smaller ones, in the same way that a 10-litre tub fills up faster than a 100-litre one.
The Dutch provincial numbers also show how the disease is spreading at different rates around the country. The RIVM has been giving this breakdown since March 24, when Noord-Brabant accounted for 31.3% of all infections.
Since then the province’s share has fallen to 26.5% and actual case numbers are falling, while Noord-Holland, Zuid-Holland and Gelderland have seen cases increase in recent days. A spike in Amsterdam, Rotterdam or The Hague could cause the overall numbers to start to rise again.
Finally, there is the question of whether stricter lockdown measures will reduce the numbers faster. Although comparing different countries’ trajectories is a tricky exercise, we can gauge how quickly the infection rate is slowing in the Netherlands with France and Spain, which announced tougher lockdowns at around the same time.
By tracking the difference over three days rather than day to day we can smooth out the kinks in the line caused by delays in reporting or a one-day spike in the numbers. In all three countries the rate has slowed steadily, and it doesn’t appear that the Dutch approach is any less effective than the French or Spanish measures.
It will take weeks before we can say definitively which country’s strategy has been the best, but one plausible conclusion is that the real difference has come from preventing mass gatherings in confined spaces: football matches, concerts, high streets, railway stations and bars and restaurants.
In all these places people come into contact with hundreds or thousands of strangers who may have travelled long distances to be there. Curbing trips to the local supermarket, church services and walks in the park is likely to have a much smaller impact.
Scientists have warned repeatedly that strict lockdowns make it harder to build up immunity and create the risk of a new spike in cases when people are let out again. The challenge for policy makers is to weigh up the risks and control the population so that the virus does not spread out of control, either today or several months from now.
Thank you for donating to DutchNews.nl.
We could not provide the Dutch News service, and keep it free of charge, without the generous support of our readers. Your donations allow us to report on issues you tell us matter, and provide you with a summary of the most important Dutch news each day.
Make a donation
